
Technical Solution Problem 15: AI Crawler Monitoring at the Cloudflare Edge
Welcome to Sydney Business Web Technical Solutions Problem 15:
AI Crawler Monitoring at the Cloudflare Edge
Every day, we solve problems for eCommerce website owners. We had a think about how we might use this activity to help others, and came up with this idea: Every week or three, we'll take the trickiest problem and publish our solution.
Important! - Some of these solututions involve adding code to your website (WordPress and Woocommerce mostly), so please ALWAYS be careful. We are not in any way responsible, directly or indirectly for any impact or consequences our code or advice has on your website, nor are we liable for any damage arising from such use.
Always back up your website before changing or adding code and/or editing the database, This is critically important!!!
Technical Solution Problem 15: AI Crawler Monitoring at the Cloudflare Edge
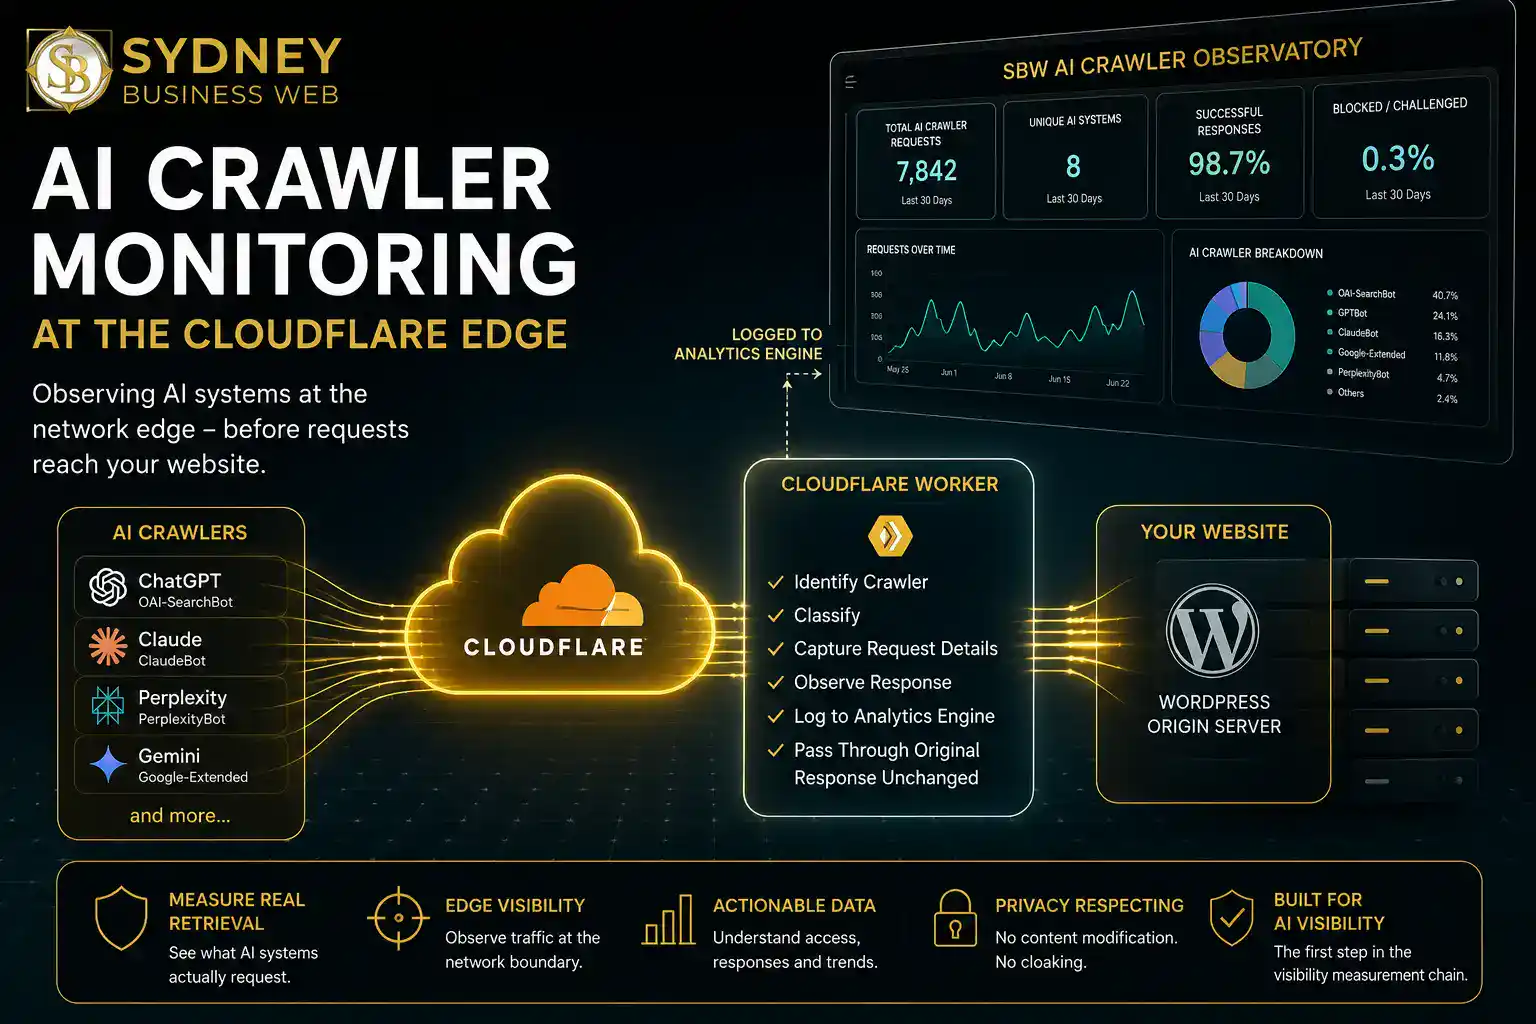
The Problem: How Do You Know an AI Crawler Actually Retrieved Your Website?
Making a website accessible to AI crawlers is important. But accessibility and actual retrieval are not the same thing.
You can allow an AI crawler in robots.txt, remove firewall blocks, configure your CDN correctly and make every page technically available — and still be left with a basic measurement problem: did an AI system actually request the content?
“The crawler is allowed to visit” is a configuration statement. “The crawler requested this URL and received this response” is evidence.
That distinction matters increasingly as businesses attempt to measure AI visibility. Search rankings, citations and AI recommendations occur further down the chain. Before any of those things can happen, an AI system first needs to discover and retrieve information from somewhere.
Robots.txt Cannot Tell You This
A robots.txt file tells crawlers what they are permitted to access. It does not tell you whether a particular AI crawler actually arrived, which pages it requested or what happened when it did.
WordPress Cannot See Everything
WordPress and conventional server-side logging operate behind the network edge. When a CDN or edge cache handles a request before it reaches the origin, application-level monitoring may never see that request at all.
Analytics Is Usually Human-Centric
Conventional analytics platforms are primarily designed around browsers, JavaScript and human visitor behaviour. AI crawlers do not behave like ordinary website visitors.
AI Visibility Needs Retrieval Evidence
If we want to understand AI visibility properly, one of the earliest useful signals is simple: which AI systems are requesting the site, which resources they request and whether those requests succeed.
Sydney Business Web therefore wanted something more useful than another visitor counter. We wanted an observation point positioned where the crawler actually enters the website infrastructure.
For an SBW website already running through Cloudflare, that suggested an unusually clean location: the Cloudflare network edge itself.
Why Put the Measurement Point at the Cloudflare Edge?
Sydney Business Web already uses Cloudflare in front of the website. The domain's nameservers are delegated to Cloudflare and normal web traffic therefore passes through Cloudflare before reaching the origin server running WordPress.
That creates a very useful engineering opportunity. Instead of trying to reconstruct AI crawler activity afterwards from WordPress, analytics software or origin-server logs, we can observe selected requests while they are passing through the network boundary itself.
AI crawler
     ↓
Cloudflare network edge
     ↓
Cloudflare Worker  →  record selected telemetry
     ↓
cache / origin
     ↓
normal website response
The important part is the position of the Worker. It is not sitting inside WordPress waiting to discover what eventually reaches PHP. It operates at Cloudflare's edge, where the incoming request can be examined before the normal website delivery process completes.
The Worker Is an Observer, Not a Different Website
The objective is not to serve AI crawlers special content. The Worker identifies relevant traffic, records useful information about the transaction and allows the site's normal response to continue.
That distinction is important. This is not cloaking, crawler manipulation or an attempt to manufacture AI visibility. A human visitor and an AI crawler can still receive the same underlying website content. We are simply instrumenting the path so that selected machine retrieval activity becomes measurable.
This also makes the architecture comparatively independent of WordPress. The measurement layer exists in front of the application. WordPress can be updated, cached or reconfigured without requiring the crawler-monitoring logic to become part of the CMS itself.
For us, that is the elegant part of the design: observe the request at the earliest useful point, record what matters, and otherwise stay out of the way.
What Does the Worker Actually Measure?
The Worker is deliberately selective. It is not intended to become another general website analytics system. Its job is to identify configured search and AI crawler families and record useful evidence about their interaction with the website.
Sydney Business Web currently recognises crawler families associated with systems including OpenAI, Google, Anthropic, Perplexity, Microsoft, Apple and xAI. Requests from unrelated or unrecognised User-Agents simply continue normally without creating AI-crawler telemetry.
Who Requested It?
The Worker identifies the crawler family and provider from configured crawler signatures, rather than treating every automated request as meaningful AI activity.
What Was Requested?
The requested URL and resource type can be classified so that an HTML page, robots.txt, sitemap or structured-data resource is distinguished from ordinary CSS, image, font or script traffic.
What Happened?
The observation can include the HTTP response status, response time, request method, available cache information and other useful characteristics of the completed transaction.
That resource classification is important. An AI crawler requesting a logo or stylesheet is technically activity, but it is not equivalent to retrieving a page containing information about the business.
Our monitoring therefore distinguishes potentially meaningful retrieval — such as documents, machine-readable files and structured-data resources — from supporting assets and other requests.
crawler:       OAI-SearchBot
provider:      OpenAI
resource:      document
method:        GET
response:      200
cache_status:  observed where available
retrieval:     meaningful
This is intentionally a simplified representation rather than the Worker's actual source code. The underlying monitoring also records timing and response information useful for analysing whether crawler requests are succeeding consistently.
Identification and Verification Are Not the Same Thing
A User-Agent string alone can be imitated. For that reason the system can separately describe the confidence behind an attribution — including Cloudflare verification or supporting network/signature evidence where available. A User-Agent-only observation is not automatically treated as verified crawler identity.
Equally important is what the Worker does not do. It does not rewrite page content, change JSON-LD, alter robots.txt, challenge the crawler or create an alternative version of the website. It operates passively and the original website response continues unchanged.
Crawlable describes possibility.
An identified crawler requesting a meaningful resource and receiving a successful response is observed retrieval.
Why Conventional Monitoring Can Miss the Event
The obvious place to look for crawler activity is the web server. Apache, Nginx, PHP and WordPress can all record requests that reach them. That remains useful information — but it is not necessarily a complete picture of what happened at the public edge of the website.
The reason is architectural. When a site is proxied through Cloudflare, the origin server is no longer the first component encountered by an incoming request.
Internet
   ↓
Cloudflare
   ↓
cache / security / routing
   ↓
origin server
   ↓
WordPress
   ↑
traditional logging usually starts here
If Cloudflare satisfies a request from cache, handles it at the edge or otherwise prevents it from reaching the origin, then an origin-only monitor has nothing to record.
That does not make server logs inaccurate. It means they describe a different observation point.
Origin-Level Observation
Answers questions about requests that reached the server: what Apache received, what PHP processed and what WordPress ultimately handled.
Edge-Level Observation
Answers an earlier question: what arrived at the public network boundary before caching, application logic and the origin server determine what happens next.
Browser-based analytics has another limitation. Systems such as Google Analytics are designed primarily around JavaScript executed inside a visitor's browser.
AI crawlers generally do not behave like ordinary human visitors running analytics scripts, accepting cookies and navigating pages through a browser session. Trying to measure machine retrieval with human-visitor analytics therefore starts with the wrong instrument.
Different Instruments Measure Different Things
Google Analytics remains useful for human behaviour. Server logs remain useful for origin traffic. Cloudflare analytics remains useful for network traffic. Our crawler monitor is designed for a narrower question: which relevant AI systems are actually requesting useful website resources, and what response are they receiving?
This is also why comparing two dashboards can occasionally produce apparently contradictory numbers. They may not be contradictory at all. They may simply be observing the request at different stages of the delivery chain, applying different classification rules or counting different resource types.
The question is not “Which analytics platform is correct?”
The engineering question is: “At what point in the system was the event measured?”
How the Worker Fits Into the Request Path
A Cloudflare Worker is a small program that can execute on Cloudflare's network when a matching request arrives. Because Sydney Business Web's traffic is already proxied through Cloudflare, no additional proxy, server or WordPress component is required to create this observation layer.
The monitoring logic can therefore remain remarkably compact. For a relevant request, the Worker performs five basic jobs.
Receive
The request arrives at the Cloudflare edge on its normal path towards the website.
Identify
The Worker determines whether the request matches one of the crawler families we are interested in observing.
Retrieve
The normal website request continues and the site's ordinary response is obtained.
Record
Relevant request and response information is classified and written as crawler telemetry.
Return
The original website response continues back to the requesting system without being replaced by crawler-specific content.
Reduced to its essential idea, the pass-through behaviour is almost embarrassingly simple.
const crawler = identifyCrawler(request);

const response = await fetch(request);

if (crawler) {
    classifyRequest(request);
    observeResponse(response);
    recordTelemetry();
}

return response;
That is not the production Worker code. The real implementation contains the crawler definitions, exclusions, resource classification, response handling, telemetry fields and safeguards needed for reliable measurement.
But the simplified fragment demonstrates the key architectural feature: measurement is added around the normal transaction rather than substituted for it.
No Second Website. No Special AI Version.
There is no duplicate AI site and no crawler-specific page-generation system. The existing Sydney Business Web website remains the source of the content.
The Worker simply adds an observational layer to traffic already passing through Cloudflare.
The telemetry itself can then be written directly from the Worker to a purpose-built data store rather than sending every raw request back to WordPress for processing.
That separation is valuable. The website remains responsible for publishing content. Cloudflare remains responsible for edge delivery. The Worker performs classification and observation. The monitoring interface can then concentrate on analysis and reporting.
The elegant part is not that the Worker does a great deal.
It is that it sits in exactly the right place to do very little.
Where Does the Crawler Data Actually Go?
Once an AI crawler event has been identified and classified, we still need somewhere to store the observation.
The obvious temptation would be to send the data back into WordPress: create a custom database table, expose an endpoint, write every event into MySQL and then build reports from there.
We deliberately did not choose that architecture.
Putting Telemetry Into WordPress
Every crawler event would have to travel back to the origin, invoke application logic and create additional database work. Monitoring traffic would become another responsibility of the production website itself.
Recording It at Cloudflare
The Worker can record selected crawler telemetry directly at the edge while the website continues doing what it was built to do: serve content.
For the Sydney Business Web implementation, selected observations are written into Cloudflare Analytics Engine. This keeps the measurement system close to the point at which the events are observed and separates telemetry collection from WordPress.
AI crawler request
        ↓
Worker classifies event
        ↓
Analytics Engine write
        ↓
crawler / URL / resource / response / timing
        ↓
reporting interface
That separation also gives us a cleaner data model. We do not need to store every byte of every HTTP transaction. We can write the specific dimensions and measurements that matter to the observatory.
For example, an event can describe the crawler family, provider, requested path, resource classification, HTTP status, timing and other selected characteristics without turning the monitoring system into a full packet-capture or general log archive.
Store Evidence, Not Noise
The objective is not to produce the largest possible log file. It is to retain enough structured evidence to answer useful questions: which AI systems are arriving, what they are retrieving, whether those retrievals succeed and how that behaviour changes over time.
The reporting layer can then aggregate those events into something far more useful than raw access logs: requests by crawler, meaningful retrievals, successful responses, frequently requested resources, time-based trends and other measures relevant to AI visibility.
Most importantly, the monitoring database is not sitting inside the WordPress production database competing with pages, products, options, sessions or plugin tables.
The website publishes the evidence.
The edge observes the retrieval.
The telemetry system records the event.
What Can We See That We Couldn’t See Before?
Once the edge observations are stored and queried, individual crawler requests stop being isolated lines in a log file. They become a measurable pattern of machine retrieval.
That allows Sydney Business Web to build an AI crawler observatory around questions that are directly relevant to AI visibility.
Which Systems Are Arriving?
Requests can be grouped by crawler family and provider, making it possible to see activity associated with different search and AI ecosystems.
What Are They Requesting?
We can distinguish ordinary assets from meaningful resources such as web pages, robots.txt, sitemaps and other information useful to machine discovery.
Did the Request Succeed?
HTTP responses allow successful retrievals to be separated from redirects, blocks, errors and other outcomes that may require investigation.
Is Retrieval Repeating?
A single request is interesting. Repeated retrieval over time is much more useful because it begins to reveal persistent machine interest in particular resources.
Which Pages Attract Attention?
Requested paths can reveal whether crawlers are concentrating on articles, service pages, technical resources or other parts of the site's information architecture.
Is Behaviour Changing?
Once observations accumulate, crawler activity can be compared over time rather than relying on an occasional manual test or isolated screenshot.
This is where the distinction between configuration and measurement becomes especially useful.
crawler permitted
       ↓
crawler reaches site
       ↓
meaningful resource requested
       ↓
successful retrieval observed
       ↓
retrieval repeats over time
       ↓
mention / recommendation / citation may follow
The first four stages in that chain are increasingly measurable. The later stages are different phenomena and require different evidence.
That distinction prevents us from claiming too much. An observed OpenAI crawler visit does not prove that ChatGPT will cite, mention or recommend the business. Nor does repeated Google crawler activity prove that a particular AI Overview will use the page.
Retrieval Is Evidence — But It Is Not the Final Outcome
The observatory gives us evidence that a machine system has reached and successfully retrieved information from the site. That is a genuine part of the AI visibility chain, but it remains only one part.
Recommendation, citation and answer inclusion must be measured separately rather than inferred from crawler activity alone.
That is precisely why we find this approach useful. It gives us another real measurement point between the technical configuration of a website and the eventual behaviour of AI answer systems.
We are moving from “AI crawlers should be able to access the site” to “we can observe when they actually do.”
Why This Matters for AI Visibility Measurement
AI visibility has a measurement problem.
It is easy to check whether a website has schema, whether a crawler is allowed in robots.txt or whether a page appears in a sitemap. Those are useful technical checks, but they mostly describe the conditions under which retrieval could happen.
At the other end of the process, we can test whether an AI system mentions a business, recommends it or cites one of its pages. Those are important outcome signals.
The difficult territory lies between those two points.
Accessible
Can the system reach the website and the resources we intend it to discover?
Retrieved
Did the crawler actually request a meaningful resource and receive a successful response?
Understood
Can the system connect the business, people, services, evidence and other entities coherently?
Surfaced
Does that information eventually appear in an AI answer, recommendation, mention or citation?
The Worker does not magically reveal all four stages. No single instrument can.
What it does give us is something important that was previously much harder to measure cleanly: direct evidence of Stage 2.
robots.txt says ALLOW
        ≠
crawler definitely arrived

crawler was observed
        +
meaningful resource requested
        +
HTTP 200 returned
        =
retrieval evidence
This means we no longer need to collapse several quite different ideas into the vague statement that a website is “AI friendly”.
We can begin separating technical accessibility, observed retrieval, entity and evidence quality, and eventual AI-system visibility into different measurements.
The Beginning of an AI Visibility Scoreboard
This crawler observatory is therefore useful as the first part of a broader measurement system.
One scoreboard can record whether AI and search crawlers are reaching and retrieving the site's information. Other measurements can then track whether the business is being recognised correctly, whether important entities and expertise are being connected, and whether those signals eventually result in mentions, recommendations and citations.
The objective is not to manufacture a single invented “AI score”. It is to expose the individual signals in the chain so that problems can actually be diagnosed.
That has a practical consequence. If a business is not appearing in AI answers, we can start asking better questions.
Is the site inaccessible? Are crawlers arriving but repeatedly receiving errors? Are the important pages being ignored? Is retrieval healthy but the entity information contradictory? Is the entity coherent but the external evidence weak?
Those are very different engineering problems — and they should not all be given the same diagnosis.
AI visibility should not be measured as one mysterious outcome.
It is better understood as a chain of observable signals.
Could We Have Built This Another Way?
Yes. There are several ways to record automated traffic to a website. The important question is not whether alternatives exist, but where they observe the request and how much additional machinery is required.
Other edge-compute platforms could implement the same general idea. A programmable reverse proxy, another CDN edge runtime or custom gateway could all be placed in front of a website and perform similar observation.
But once the Sydney Business Web domain was already using Cloudflare as its authoritative DNS and proxy layer, introducing another network component solely for crawler monitoring would have added complexity without solving a new problem.
Alternative:
crawler → CDN → origin → WordPress/plugin → database

SBW approach:
crawler → Cloudflare Worker → normal response
                    ↓
                telemetry
The Design Principle Was Simplicity
Do the measurement as close as practical to the point of observation. Record only the information needed for analysis. Keep the monitoring system away from the production CMS wherever possible.
Cloudflare was already in the request path. The Worker therefore turns an existing infrastructure layer into an instrumentation layer rather than adding another one.
That is why the architecture appeals to us from an engineering perspective. It is not the only possible implementation. It is simply a particularly economical one for a website already operating behind Cloudflare.
Good engineering is often not about adding another system.
It is about recognising that the right system is already in the right place.
What This System Does Not Tell Us
Good measurement depends as much on understanding the limits of an instrument as understanding what it can measure.
An observed AI crawler retrieval is useful evidence. But it would be wrong to treat that event as proof that the information was subsequently understood, stored, selected for an answer or shown to a user.
Understanding
A successful retrieval does not tell us exactly how an AI system interpreted the business, its services, its people or the relationships between those entities.
Recommendation
A crawler visit does not mean the business will subsequently be selected when someone asks an AI system for a supplier, expert or recommendation.
Citation
Even repeated retrieval does not guarantee that a particular page will appear as a source or citation in a generated answer. That outcome needs to be observed separately.
There is another important distinction. Different crawler identities may support different functions within the same provider's ecosystem. Search indexing, answer retrieval, model training and user-triggered fetching are not necessarily the same process.
For that reason, the observatory records what it can actually observe: a particular crawler identity requested a particular resource and received a particular response.
OBSERVED:
OpenAI-associated crawler
requested /example-page/
and received HTTP 200

NOT AUTOMATICALLY PROVEN:
"ChatGPT understands this page"
"ChatGPT will recommend this business"
"ChatGPT will cite this URL"
That Limitation Is a Feature, Not a Weakness
If retrieval evidence is kept separate from recommendation and citation evidence, each stage can be measured honestly.
It also becomes possible to diagnose where a visibility problem may actually exist. Healthy retrieval combined with poor AI recognition suggests a very different problem from a website that AI systems are not retrieving successfully in the first place.
Sydney Business Web therefore treats crawler telemetry as one evidence layer within a larger AI visibility model — alongside technical accessibility, entity coherence, corroborating evidence and direct testing of how AI systems describe and surface the business.
A crawler visit is not an AI recommendation.
It is something more modest — and more defensible: evidence that retrieval actually occurred.
From Raw Events to an AI Crawler Observatory
Individual crawler events are useful for diagnosis, but nobody wants to spend their day reading raw request records.
The final part of the system therefore turns Cloudflare edge telemetry into a human-readable monitoring interface: an AI crawler observatory showing what recognised machine systems are actually requesting from the website.
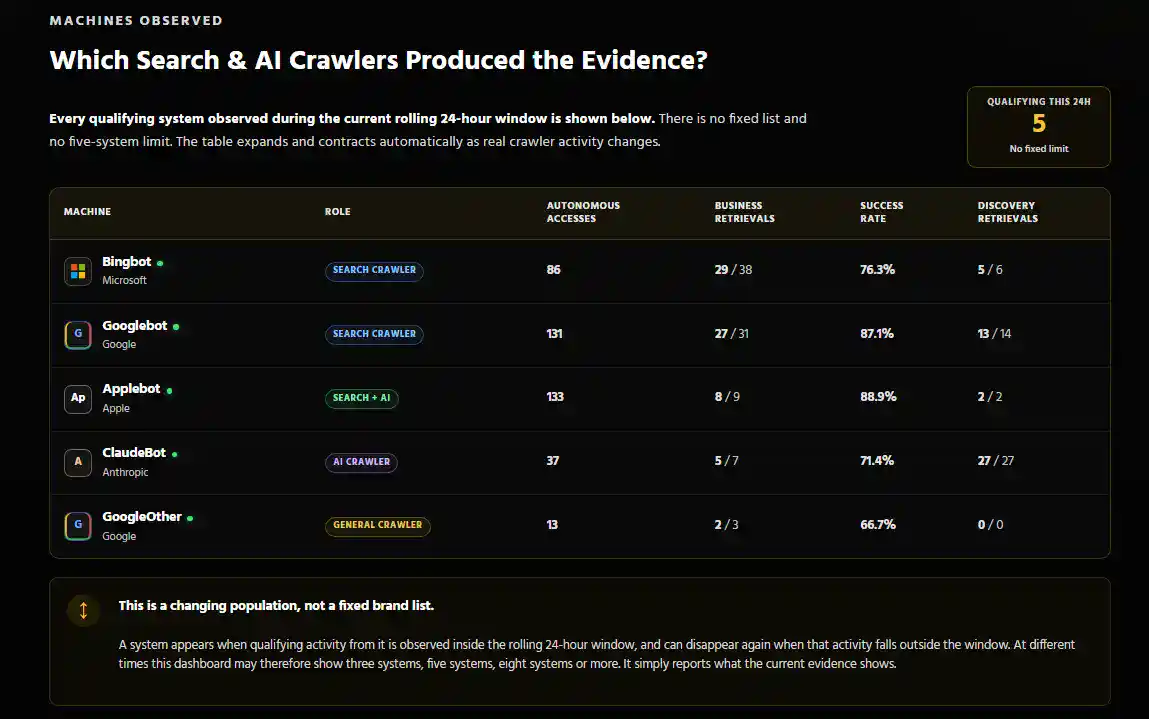
The dashboard is not another source of traffic data. It is the reporting layer sitting above observations already collected by the Worker and written into the telemetry system.
Requests Over Time
We can see whether crawler activity is occasional, increasing, declining or recurring rather than relying on a single visit.
Crawler Breakdown
Activity can be separated by recognised crawler family so that different providers do not disappear inside a generic bot total.
Meaningful Retrievals
Requests for useful information resources can be separated from supporting assets and other machine traffic.
HTTP Outcomes
Successful responses can be distinguished from redirects, errors and other outcomes that may expose an accessibility problem.
Requested URLs
The observatory shows which parts of the website machines are actually retrieving rather than merely which pages we hope they will discover.
Recent Activity
Individual observations remain available when we need to trace a crawler, URL or response event in more detail.
Individual records answer the forensic question: what just happened? Aggregation answers a different and equally important question: what pattern is developing?
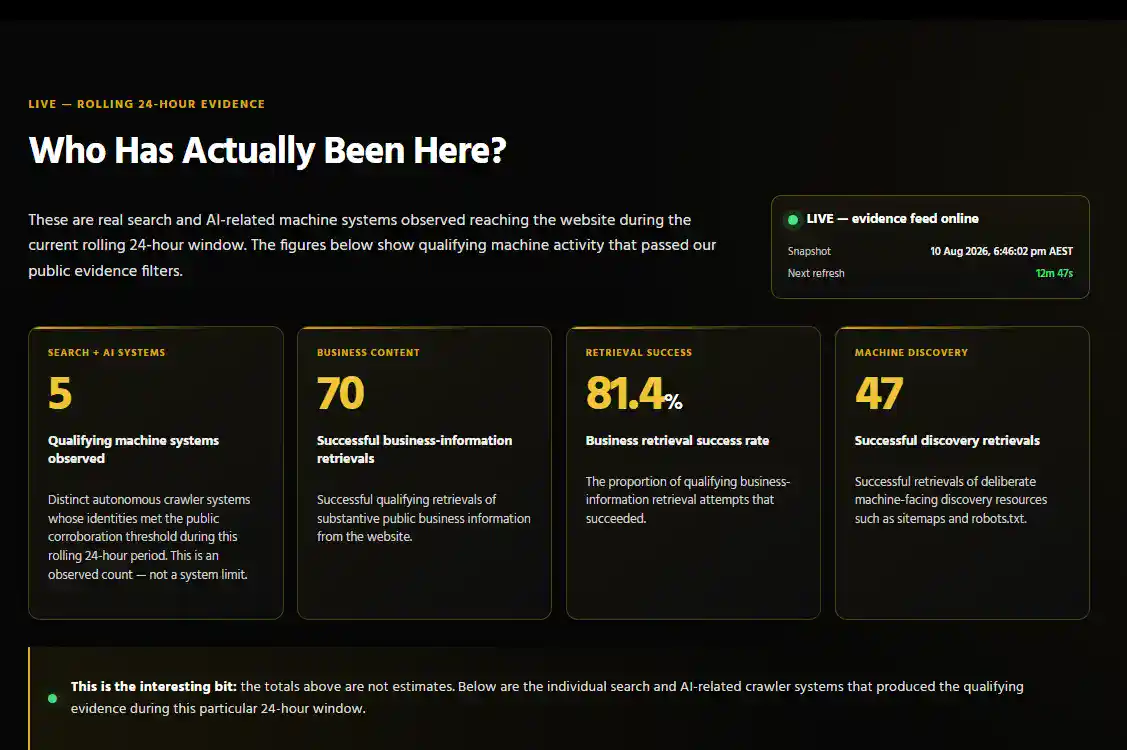
A rolling view is particularly useful because a crawler visit by itself may mean very little. Repeated activity begins to show whether particular systems are returning to the site and whether retrieval behaviour changes after content or infrastructure changes.
OLD:
"Are AI crawlers allowed?"

BETTER:
"Which AI crawlers arrived?"

BETTER AGAIN:
"What did they retrieve?"

AND:
"Did retrieval succeed?"

THEN:
"Is that behaviour changing over time?"
Measurement Before Interpretation
AI visibility discussions can very quickly become speculative. The observatory does not tell us why an AI system eventually chooses one business over another, but it gives us real observations before we start forming explanations.
If crawler access changes after a firewall adjustment, we can look for the corresponding retrieval change. If important new content is published, we can observe whether relevant crawlers subsequently request it. If errors appear, we have something concrete to investigate.
Over time, this creates a historical record of machine retrieval activity against which changes to content, technical configuration and eventual AI visibility can be compared.
The observatory is not trying to predict what an AI system thinks.
It starts with the more useful engineering question: “What did the system actually do?”
What Does This Mean In Practice?
Most businesses do not need to know how a Cloudflare Worker executes, how telemetry is written or how the reporting queries are constructed. They need to know whether the technical work being done to improve AI visibility is producing observable changes.
That is where this type of monitoring becomes useful. It converts part of the AI visibility process from assumption into evidence.
Diagnosing Crawler Access
If an important crawler disappears, begins receiving errors or stops retrieving meaningful pages, we have a technical condition that can be investigated rather than guessed at.
Checking Infrastructure Changes
Firewall, caching, CDN and robots.txt changes can be followed by real crawler observations to determine whether machine access has actually changed.
Watching New Content
After an important service page, article or technical resource is published, we can observe whether relevant crawlers subsequently return and request it.
Separating Problems
Healthy retrieval but weak AI recommendations points us towards entity, evidence or authority issues. Poor retrieval points us towards a much earlier technical problem.
This matters because there is a growing temptation to sell AI visibility as though it were one mysterious switch: install some schema, submit a file, buy a tool and wait for ChatGPT or Google to start recommending the business.
Real systems are not that simple.
ACCESS PROBLEM?
      ↓
fix crawlability / delivery

RETRIEVAL HEALTHY?
      ↓
inspect entity clarity / content / evidence

ENTITY COHERENT?
      ↓
inspect external corroboration / authority

ALL HEALTHY?
      ↓
measure mentions / recommendations / citations
This Is Why Measurement Matters
Without observations at different stages of the chain, every poor AI visibility result risks receiving the same prescription.
With better instrumentation, the question changes from “What AI optimisation should we do?” to “Where in the retrieval and visibility chain is the system actually failing?”
That is a much more useful engineering question — because once the failure point is identified, the work can be directed towards the actual problem rather than another fashionable optimisation tactic.
You cannot engineer what you cannot observe.
And you should not claim to have improved something you have never actually measured.
From Crawler Access to Observable AI Retrieval
The purpose of this project was not to build another analytics dashboard. It was to answer a specific technical question that conventional AI visibility testing does not answer particularly well: are relevant machine systems actually retrieving the information we have made available to them?
Putting a Cloudflare Worker into the existing request path gave Sydney Business Web an unusually clean answer. The website continues operating normally, while selected AI and search crawler activity can be identified, classified and recorded at the network edge.
The result is a measurement layer between configuration and outcome. We can distinguish being technically crawlable from being actually retrieved — without pretending that retrieval automatically means understanding, recommendation or citation.
accessible
    ↓
observed retrieval
    ↓
entity understanding
    ↓
recommendation / mention
    ↓
citation

Different stages.
Different evidence.
Different measurements.
For us, this is where AI visibility engineering becomes more useful. Instead of treating AI visibility as a mysterious score, we can begin instrumenting individual parts of the system and asking where the evidence changes.
The Cloudflare crawler observatory is therefore not the whole AI visibility measurement system. It is one instrument within it — but it measures an important stage directly.
The objective is not to claim that AI can see your website.
The objective is to build systems capable of showing what we can actually prove.
Want to Know What AI Systems Can Actually Retrieve About Your Business?
Sydney Business Web combines crawler-access testing, entity architecture, structured data, technical website engineering and evidence analysis to identify where a business is strong — and where its AI visibility chain is breaking down.
Further Reading and Technical References
This implementation sits within a broader Sydney Business Web approach to machine retrieval, entity clarity, crawler access and measurable AI visibility. The following internal and primary technical references provide the surrounding context.
Sydney Business Web — Related Work
Primary External Technical References
External links above point to primary Cloudflare technical documentation. Sydney Business Web is an independent business and is not affiliated with Cloudflare.
Frequently Asked Questions About AI Crawler Monitoring
These are the most important distinctions to understand when using crawler activity as evidence within a broader AI visibility measurement system.
What is AI crawler monitoring?
AI crawler monitoring records requests made to a website by recognised crawler identities associated with search and AI systems. Depending on the implementation, this can include the crawler family, requested URL, resource type, HTTP response, timing and other selected information.
Why monitor AI crawlers at the Cloudflare edge?
For a website already proxied through Cloudflare, the edge sits in front of the origin server and WordPress. A Worker running on that request path can therefore observe selected traffic before application-level logging becomes relevant. It creates a useful measurement point without requiring the crawler-monitoring logic to live inside the CMS.
Does the Cloudflare Worker show AI crawlers different content?
No. The Sydney Business Web implementation is intended as an observational layer. It identifies and records selected crawler activity while allowing the website's normal response to continue. It is not designed to create a separate AI version of the website or to serve crawler-specific claims.
Does an AI crawler visit mean ChatGPT, Gemini or another AI system will recommend the business?
No. A crawler visit is evidence of retrieval activity, not evidence of recommendation. Retrieval, machine understanding, answer selection, recommendation and citation are different stages and need to be measured separately.
Can an AI crawler User-Agent be spoofed?
Yes. A User-Agent string by itself is not proof of identity because it can be imitated. That is why crawler identification and crawler verification should be treated separately, using stronger network or provider verification evidence where it is available.
Does this replace Apache logs, Cloudflare analytics or Google Analytics?
No. Those tools answer different questions. Server logs describe traffic that reaches the origin. General Cloudflare analytics describes broader network activity. Browser analytics primarily measures visitor behaviour. The crawler observatory is deliberately narrower: it focuses on selected machine retrieval activity relevant to search and AI visibility.
Why use Analytics Engine instead of storing the crawler events in WordPress?
Keeping the telemetry outside WordPress separates website publishing from crawler measurement. The Worker can write selected structured observations directly into Cloudflare's analytics infrastructure without turning every crawler event into additional WordPress or MySQL work.
What does a successful AI crawler retrieval actually prove?
At its strongest, it proves something quite specific: an identified or classified crawler requested a particular resource and the website returned the recorded response. It does not by itself prove that the information was understood, retained, recommended or cited.
Can this monitoring help diagnose AI visibility problems?
Yes. It helps separate an early retrieval problem from later visibility problems. If important crawlers cannot successfully retrieve the site, the problem may be technical. If retrieval is healthy but the business is still poorly represented in AI answers, investigation can move towards entity clarity, content, corroboration and evidence instead.
The useful question is not simply “Can AI crawl the website?”
It is: “What evidence do we have for each stage of the visibility chain?”